


Delve is a very powerful tool to debug Go programs. For example, we can:
Set breakpoints and execute line-by-line.
Trace execution flow e.g.
main -> fn1 -> fn2.View function parameters, and local/package variables and modify their values.
List, filter, and examine Go routines, and switch to a specific Go routine or thread.
List and analyze stack frames (can be useful to debug recursive functions)
Examine memory used by a certain address.
Debug a remote Go program e.g. inside a container.
Installation
go install github.com/go-delve/delve/cmd/dlv@latest
Examples
Run Go code in debug mode with breakpoint
 dlv debug algo.go
 Type 'help' for list of commands.
 # adding breakpoint in line num 15
 (dlv) break algo.go:15
 Breakpoint 1 set at 0x1021828c0 for main.fibRecur() ./algo.go:15
 # resume execution using 'continue' command
 (dlv) continue
 > main.fibRecur() ./algo.go:15 (hits goroutine(1):1 total:1) (PC: 0x1041a68c0)
 14: func fibRecur(n int) int {
 => 15: if n <= 2 {
 16: return 1
Print variables and function arguments
 (dlv) args # prints function arguments and their values
 n = 30
 ~r0 = 0
 (dlv) locals # prints local variables at this execution
 (no locals)
 continue
 next
Show code around the current breakpoint
 (dlv) list
 > main.fibRecur() ./algo.go:15 (hits goroutine(1):4 total:4) (PC: 0x102ab28c0)
 14: func fibRecur(n int) int {
 => 15: if n <= 2 {
 16: return 1
 17: }
 18: return fibRecur(n-1) + fibRecur(n-2)
 19: }
Clear breakpoint and continue the code execution
 (dlv) clearall # deletes all breakpoints
 Breakpoint 1 cleared at 0x1046c28c0 for main.fibRecur() ./algo.go:15
 (dlv) continue # continues code execution
 fibRecur res: 832040
 finished in 51.890292084s
 fibDynamic res: 832040
 finished in 69µs
 Process 64689 has exited with status 0
Display Goroutines
Lists current goroutines, including the main function and Garbage Collector.(dlv) goroutines * Goroutine 1 - User: ./algo.go:15 main.fibRecur (0x1021828c0) (thread 5969677) Goroutine 2 - User: /Users/nirdosh/.gvm/gos/go1.21.1/src/runtime/proc.go:399 runtime.gopark (0x102116ba0) [force gc (idle)] Goroutine 3 - User: /Users/nirdosh/.gvm/gos/go1.21.1/src/runtime/proc.go:399 runtime.gopark (0x102116ba0) [GC sweep wait] Goroutine 4 - User: /Users/nirdosh/.gvm/gos/go1.21.1/src/runtime/proc.go:399 runtime.gopark (0x102116ba0) [GC scavenge wait] Goroutine 5 - User: /Users/nirdosh/.gvm/gos/go1.21.1/src/runtime/proc.go:399 runtime.gopark (0x102116ba0) [finalizer wait]Switch to a specific goroutine
 # goroutine
 (dlv) goroutine 2
 Switched from 1 to 2 (thread 5969677)
View Call Stack
 (dlv) stack
 0 0x0000000102ab28c0 in main.fibRecur # recursive function called 2nd time
 at ./algo.go:15
 1 0x0000000102ab28e8 in main.fibRecur # recursive function called 1st time
 at ./algo.go:18
 2 0x0000000102ab2ac8 in main.main
 at ./algo.go:40
 3 0x0000000102a46744 in runtime.main
 at /Users/nirdosh/.gvm/gos/go1.21.1/src/runtime/proc.go:267
 4 0x0000000102a71094 in runtime.goexit
 at /Users/nirdosh/.gvm/gos/go1.21.1/src/runtime/asm_arm64.s:1197
See arguments in a specific call stack
 (dlv) stack 0 -full
 0 0x0000000102ab28c0 in main.fibRecur
 at ./algo.go:15
 n = 27 # variable passed to the function 'fibRecur'
 ~r0 = 0
Tracing
 (dlv) trace main.main # enabling tracing for 'main' function
 Tracepoint 1 set at 0x104afaaa0 for main.main() ./algo.go:38
 (dlv) continue
 > goroutine(1): main.main()
 fibRecur res: 5 # fibRecur fn was called and it returned 5
 finished in 41.042µs
 fibDynamic res: 5. # fibDynamic fn was called and it returned 5
 finished in 2.708µs
 >> goroutine(1): => ()
 Process 66401 has exited with status 0
Attach
dlvto a running process
Note that the code execution can be at any point(line number) when you attach the debugger. So, factor this while adding breakpoints.# ------- build and run go binary ---------- go build -o testbinary main.go ./testbinary # ------- attach debugger ----------- # from another terminal session, get process id pgrep testbinary 88848 # use pid from above dlv attach 88848 (dlv) break main.go:28 (dlv) continueDisplay command details
# command: help
(dlv) help goroutines
Record command output from the current debug session in a file
(dlv) transcript algo_debugug.txtIntegration with code editors
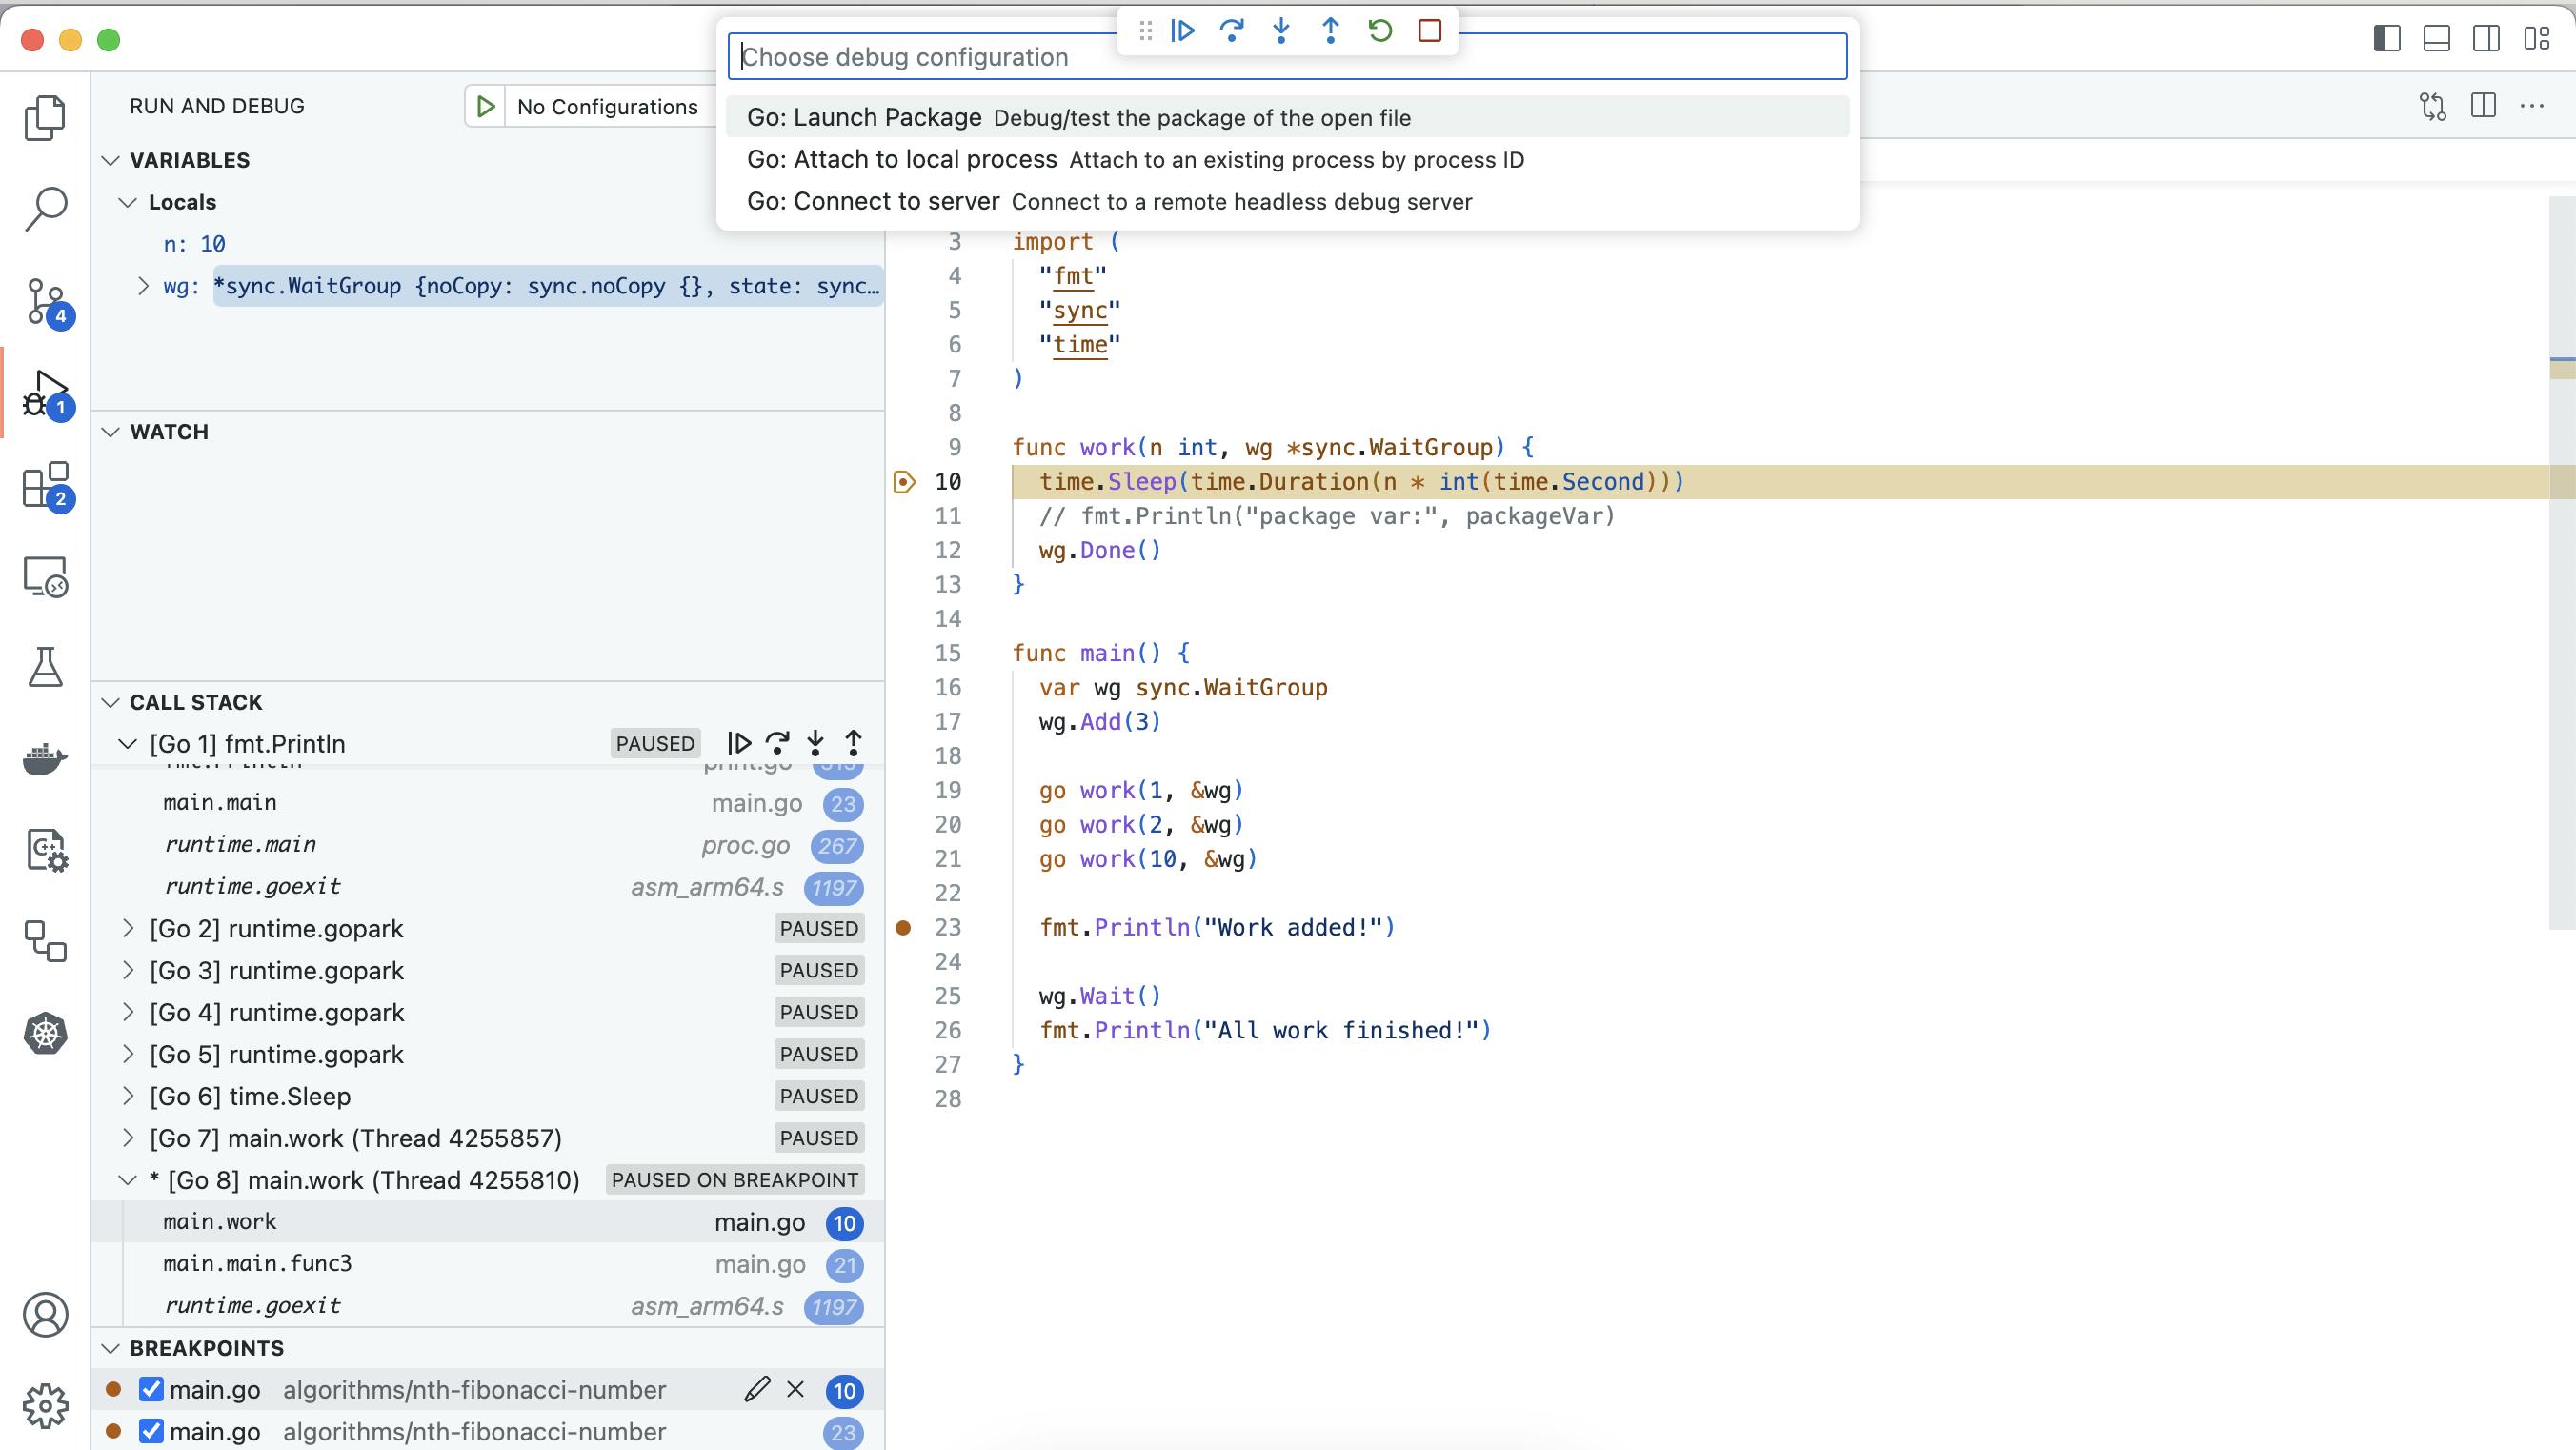
In VSCode,dlvis bundled with the vscode-go extension.